
Files
Download Full Text (522 KB)
Description
DOI: 10.62812//GRRV1852
Interactive map: https://arcg.is/1jeTb83
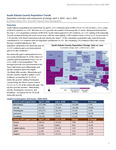
This report is in relation to this interactive map that shows how population change varied across South Dakota’s 66 counties between April 1, 2020 and July 1, 2025. It distinguishes overall population gain or loss and the demographic components behind those changes: natural change—births minus deaths—and net migration—people moving into a county minus those moving out.
Overview:
South Dakota’s population increased from an April 1, 2020 estimates base of 886,656 to 935,094 on July 1, 2025, a gain of 48,438 residents, or 5.5%. This base-to-2025 growth rate ranked 13th among the 50 states. Measured instead from the July 1, 2020 population estimate of 887,808, South Dakota gained 47,286 residents, or 5.3%, ranking 10th nationally.
Publication Date
7-2026
Publisher
South Dakota State University
Disciplines
Demography, Population, and Ecology | Regional Sociology | Rural Sociology | Sociology
Recommended Citation
Zhang, Weiwei, "South Dakota County Population Trends : Population estimates and components of change, April 1, 2020 - July 1, 2025" (2026). Center for Rural Vitality and Community Well-being Project Reports. 6.
https://openprairie.sdstate.edu/census_data_project-reports/6
Included in
Demography, Population, and Ecology Commons, Regional Sociology Commons, Rural Sociology Commons