
This collections houses completed project reports generated by the Center for Rural Vitality and Community Well-being and their project partners.

-
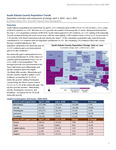
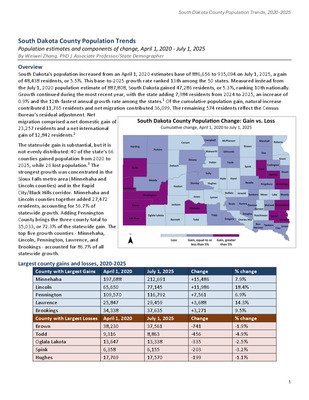
South Dakota County Population Trends : Population estimates and components of change, April 1, 2020 - July 1, 2025
Weiwei Zhang
DOI: 10.62812//GRRV1852
Interactive map: https://arcg.is/1jeTb83
This report is in relation to this interactive map that shows how population change varied across South Dakota’s 66 counties between April 1, 2020 and July 1, 2025. It distinguishes overall population gain or loss and the demographic components behind those changes: natural change—births minus deaths—and net migration—people moving into a county minus those moving out.
Overview:
South Dakota’s population increased from an April 1, 2020 estimates base of 886,656 to 935,094 on July 1, 2025, a gain of 48,438 residents, or 5.5%. This base-to-2025 growth rate ranked 13th among the 50 states. Measured instead from the July 1, 2020 population estimate of 887,808, South Dakota gained 47,286 residents, or 5.3%, ranking 10th nationally. -
South Dakota Newcomers Survey Report
Weiwei Zhang and Kara Harders
Project Overview:
While more populous states typically attract larger numerical influxes from other states and abroad, South Dakota has nevertheless experienced growth in immigrants, both from other states and internationally. In 2024, South Dakota State University Extension launched a state-wide Newcomer Survey to gain a better understanding of the newcomer population. Following prior work in Minnesota and Montana, the South Dakota Newcomers Survey was developed to collect data about the motivations that drive people to move to South Dakota, what they enjoy once moved, what they want more or less of, and ultimately what makes them want to, or not want to stay. By understanding the reasons people chose to move to South Dakota and their experiences in their new community, we can better inform communities of their current strengths, what improvements will be the most impactful, what can be done to help retain people in their communities, and how to create communities people want to live in. The survey was distributed virtually to identified individuals who moved to rural communities in South Dakota in recent years. Data was collected between January 1, 2024, and December 31, 2024. Data analysis was completed in July-September 2025. This report summarizes the Newcomer Survey data analysis and findings. Starting with describing the sample characteristics and geographic distribution (Part 3.1), the report focuses on the findings in four domains related to newcomers’ motivation to move and resettlement experiences: factors influencing the choice of residence, involvement with the new community, community satisfaction, and specifically the intent to remain in the community after five years of residence.Part 3.2 examines primary reasons for moving and other factors influencing their choice of residence such as job opportunities, economic considerations, access to amenities, social and cultural factors such as preferred proximity to family and friends, and individual preferences related to lifestyle and personal needs. Factors are ranked by respondent’s perceived importance. Different patterns among age groups and movers to rural/urban communities are discussed.
The integration of newcomers within a community, encompassing both social and built environment, is the focus of Part 3.3. We explore two key aspects of newcomer integration through analyzing the extent newcomers engage in activities that foster social cohesion and community development, their use of natural features like rivers and lakes, as well as built infrastructure including parks and community centers. We also examine possible variations among newcomers based on age group and geographic location of communities.
Part 3.4 investigates newcomer satisfaction across several key dimensions of their new community, including trust, safety, social integration, economic well-being, school systems, housing, family support, and the physical and built environment.
Part 3.5, the concluding element of this analysis, examines how newcomers’ intention to stay varies by selected characteristics, the level of their social interactions and use of community amenities, and what aspects of the community with the highest level of reported dissatisfaction among residents had the strongest negative impact on their intention to stay.
-
The Impacts of Brookings Health System on the Economy of Brookings County and Rural Health in South Dakota
Weiwei Zhang
Project Overview:
Located in Brookings County, South Dakota, Brookings Health System (Brookings Health) is a vital economic and healthcare hub, providing crucial employment and access to care. This assessment provides a comprehensive evaluation of the profound impacts of Brookings Health on the county economy, and the accessibility and affordability of healthcare services to rural populations in the surrounding areas. Rural community hospitals serve as foundational drivers of local economies. Their operations necessitate a substantial local workforce, encompassing a wide array of positions from clinical to administrative, representing a considerable labor expense. Indeed, numerous hospitals rank among the premier individual employers within their respective local and regional economies. The first part of the assessment evaluates the hospital’s economic impact on Brookings County’s economy by leveraging the 2020-2024 Quarterly Census of Employment and Wages through the Bureau of Labor Statistics and the hospital’s 2020-2024 employment and payroll data. The analysis incorporates both direct and indirect effects, with the latter, also known as “multiplier” or “ripple” effects, being quantified through the application of economic multipliers that capture the broader influence of hospital operations and labor expenditures on the local and regional economic landscape. The second part of the assessment evaluates the hospital’s pivotal role in delivering accessible and affordable healthcare to local communities. Drawn from 2019-2024 data extracted from the Inpatient and Outpatient Data Bases compiled by the South Dakota Association of Healthcare Organizations (SDAHO), this study examines the hospital’s role in rural healthcare service delivery, attributing the observed impacts to variations in travel expenses and service charges between Brookings Health and its competitors. Travel time and distance along rural road networks are calculated to determine the nearest competitor for equivalent services. This data is then used in a simulation analysis to quantify the financial burden on patients if they accessed these alternative facilities. Data on the average charge per visit for the period 2019-2024 is employed to evaluate variations in service pricing between Brookings Health and its closest competitors within each community across the hospital’s service area. The study additionally explores the demographics, financial data, and residential areas of patients utilizing the hospital’s medical services from 2019 to 2024.
-
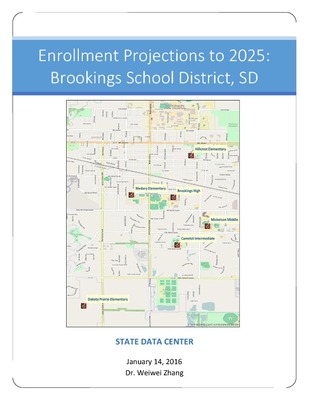
Enrollment Projections to 2025: Brookings School District, SD
State Census Data Center
This report has four parts. The first section is a summary of findings for the K-12 enrollment in the Brookings School District between 1999 and 2015 and the projections to the year of 2025. The second section describes the enrollment trend of k-12 students at Brookings School District from 1999 to 2015. The data are provided by the district. Time trends in the historical enrollment data and factors such as natural increase/decrease and migration that have influenced the enrollment are discussed. Understanding time trends and the related factors are critical for making the projections. The third section provides projections by grade and year. Discussions of projection assumptions, limitations, and potential adjustments are included. The fourth section includes maps showing the distribution of population and families with children at the Census block level and changes in the past decade on the block and block-group levels in Brookings School District. Demographic trends within the school district illustrated in the maps offer an overview of the geographic arrangement of the population and families within the school district. In addition, population projections to 2035 and population pyramids by age and gender for Brookings County are included in the last section.
-
Projections of the First-Year Full-Time Undergraduate Enrollment at South Dakota State University to 2020
Census Data Center
This report has three parts. The first section provides a brief description of the full-time first-year (FYFT) undergraduate cohort enrolled at South Dakota State University (SDSU) from 2005 to 2014. The second section provides projections by year for the FYFT enrollment to the year 2020. The third section provides project changes between 2014 and 2020 in public high school graduates in South Dakota by school district. Three datasets are utilized for this report. The FYFT undergraduate enrollment data from 2005 to 2014 are provided by the Institutional Research Office at SDSU. These data are used for preparing descriptive statistics and calculating numbers of high school graduates from South Dakota, Minnesota, and Iowa, respectively, enrolled at SDSU as FYFT students from 2005 to 2014. Data of enrollment in grades 7-12 from 2009 to 2012 and numbers of high school graduates from 2005 to 2014 are downloaded from the Department of Education of South Dakota, Minnesota, and Iowa, respectively. These data are used to calculate: (1) grade-progression rates and graduation rates; and (2) numbers of enrollment in grades 7-12 in 2014. The enrollment and graduation data by school district in South Dakota are used for projections of changes in numbers of high school graduates by school district in the state. Finally, a crosswalk file linking the Census school district identification and the within-state school district identification is derived from National Center for Education Statistics (NCES) for making the school district map.
-
The Report on Agricultural Heritage Museum -- A Survey of Students and Faculty at South Dakota State University and Members of the Museum
Census Data Center and Mary Emery
The Agricultural Heritage Museum (Ag Museum), located on the SDSU campus, has been in business since 1884.1 The Ag Museum started as a zoological collection and has grown into a comprehensive museum with incomparable collections of Agricultural history in South Dakota. In the museum visitors can explore the infinite richness and complexity of the past and learn about the technology of farming in the Northern Great Plains. Recently, the Ag Museum is in the process of composing a strategic plan to address the new challenges and opportunities for the future development. The Board and staff of the Ag Museum want to seize upon the unique features of the museum and leverage them in a way that is fresh, vibrant, and relevant for visitors from communities inside as well as outside South Dakota. Taking an honest look at both the Ag Museum’s strengths and shortcomings was where the journey for the planning process began. The new director conducted an initial assessment of the strengths and challenges based on the expertise and experience of the staff. In November 2014, the State Data Center (SDC) at South Dakota State University (SDSU) was chosen to conduct a broader needs assessment and assist with facilitating the planning process. The SDC agreed to conduct the current project, including conducting focus groups across the state and collecting data from members of the Ag Museum, students and faculty from SDSU. The data gathered from the interviews and surveys included diverse perspectives about the history, challenges, and hopes for the future of the Ag Museum. The findings provide an overall assessment of how different groups view the Ag Museum as well as their perspectives about the Ag Museum’s physical displays, current exhibits, operations, accessibility, and its practical use as a resource. Finally, the assessment offers suggestions to fuel the planning work for a new direction for the Ag Museum Analyses of the data showed that the three groups (i.e. students, and museum members) generated different patterns in assessing the current operation of the museum and presented various needs, expectations, and opportunities for future development.